Density is a mobile app that displays which facilities on campus are the most crowded.
Role: Product Designer
Team: Two other designers, two product managers, four developers. The Density team is a Cornell Design and Tech (DTI) sub-team. DTI is an engineering project team, or organization, dedicated to solving community problems and fostering campus growth through app and web development. Find out more about DTI here.
Timeline: Around two months
---
Introduction
Last semester, one of our PMs Andrew created a rudimentary version of Density and put it to the test for a single study spot on campus. The idea proved to be worth studying as the tester gained 800+ users.
With that, we kicked off the semester working on Density full force. Our team came together in early September to piece together a semester and year long roadmap which included us soft launching at the end of the Fall 18 semester.
Hypothesis
Many study spots and eateries on campus are extremely crowded at unpredictable times, driving already stressed students in a frenzy. We hypothesized that Cornell students need but lack sufficient information regarding the current crowdedness of facilities on campus.
Goal
Make daily routines & facility choice easier by allowing students to see which dining halls, eateries, gyms, libraries & study-spots are full.
Target Audience
Since we have access to Cornell University facility data we decided to focus on Cornell undergraduates and graduate students who are:
- 18-26 years old
- Busy
- Stressed
- Studious
Questions for our Team to Answer:
1. Is our hypothesis correct? Will students actually use our product?
2. If so, how can we measure the density of facilities on campus?
3. How should we present this data in an effective and useful way?
We started by answering the first question with some initial user research.
User Research
Is our hypothesis correct? Will students actually use our product?
User Interviews
We started off by collecting data from our fellow Cornellians. Collectively we conducted 90 in-person user interviews. We asked them questions like...
- Walk me though your day. Which libraries/eateries/facilities did you go to today?
- Why did you go to those particular facilities?
- If anything, what detracts/deters you from going somewhere?
- If anything, what promotes you to go somewhere?
Synthesizing the Data
We found that
- Crowdedness is an almost universal factor in deciding where to study, eat, and how long someone stays at a given location
- Over 70% of people had to move or leave a study space or eatery because it was too full before
- Over 90% of people wanted to see this data on a mobile app rather than a website
- On average, people spend 1-2 hours studying in one place at a time during the day, roughly 2-6+ hours at night, 45 minutes at the gym, and 45 minutes at an eatery or dining hall
This data confirms our hypothesis thus far ✅
Market Research
How can we measure the density of facilities on campus?
Now, with our hypothesis confirmed, I searched for other applications and products that solved similar crowd problems to answer the next question.
I found these products:
Columbia University Density App: A web based product that used wifi to measure the density of facilities on Columbia's campus https://density.adicu.com/
CrowdZen, the UCLA Density App: A web based product that used wifi to measure the density of facilities on UCLA's campus https://crowdzen.cs.ucla.edu/
(Another product called) Density: A Hardware sensor that counts people in location by using state-of-the-art depth data, computer vision, and deep learning to anonymously count people https://www.density.io/
We asked our Columbia and UCLA friends: Columbia Density and UCLA's CrowdZen were not widely used on their campus. Columbia Density was also deemed inaccurate.
From our market research we can see the most popular ways of measuring people density are the use of wifi, and hardware sensors/AI. However, we faced issues regarding these two ideas.
Constraints
1. We can't use Hardware sensors
Cornell administration would not allow for them.
2. We can't use wifi
Our team studied the Columbia and UCLA app APIs. Both apps work via wifi. The app measures people in a given building by counting how many devices are using that building's wifi. Our team met with the Technology Administration at Cornell. We found that using wifi was also out of the question, as our wifi isn't broken up into different buildings, but quads on campus. Instead of one building being attached to one wifi signal, five or so are. Using wifi wouldn't be accurate enough for our app.
3. We Don't Have Access to Gym Data
The Cornell Fitness Centers moved to a different vendor for their card swipe system, and they operate that system independently, outside of Cornell IT.
4. Manual & Community Based Tracking
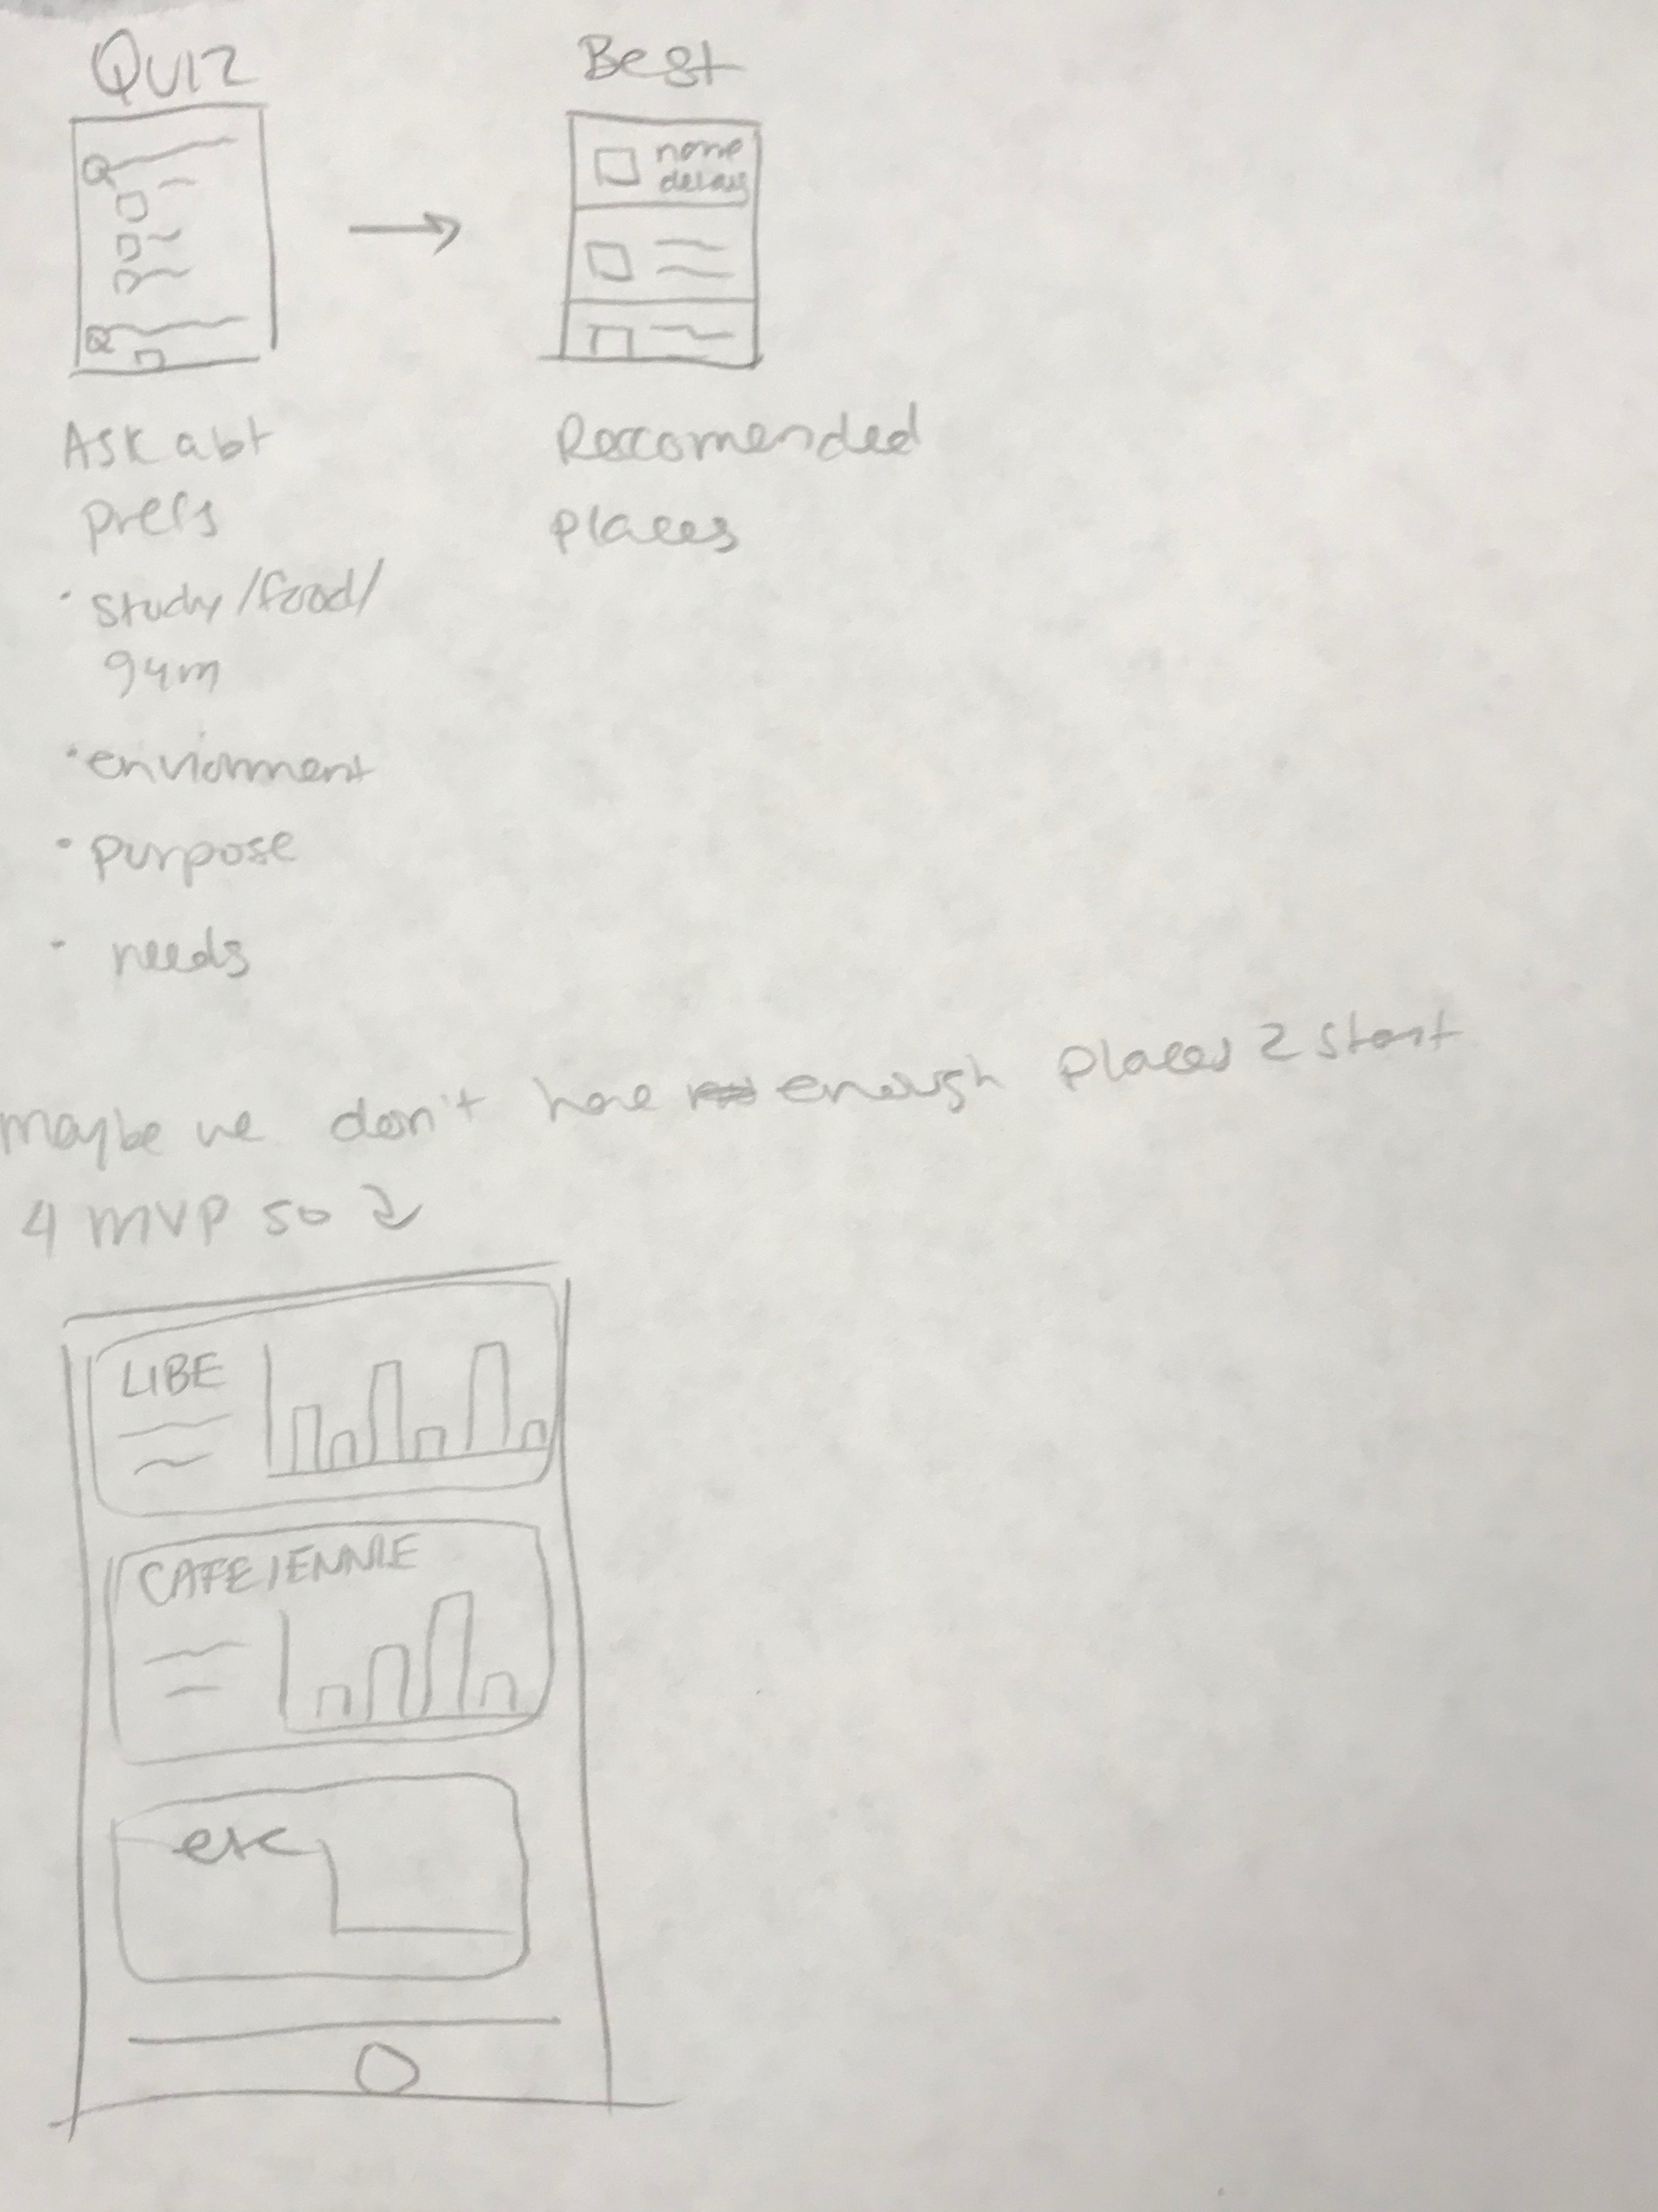
One teammate brought up the idea of having the app be community based. People would just input how crowded the study space was. We wouldn't have to do any work. I countered that that would only work if enough people used our app. We would have to manually track the occupancy of study spaces at first, find accurate average, and once the app gained traction, open it up to the community. This would take time and we had to get moving quickly. We would have to save study spots for later and focus on just eateries and dining halls for the MVP instead.
5. For Eateries and Dining Halls: The Swipe API ✅
After meeting with the Dining Administration, we were granted permission to use the Swipe API which allows us to track the number of transactions preformed at all of the on-campus eateries, and all of the entries at each dining hall in real time.
Brainstorming
How should we present this data in an effective and useful way?
Inspiration
How do other apps display similar information? Which of these do it well? I set out to find the answer.
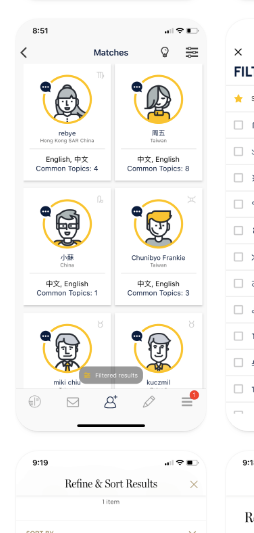
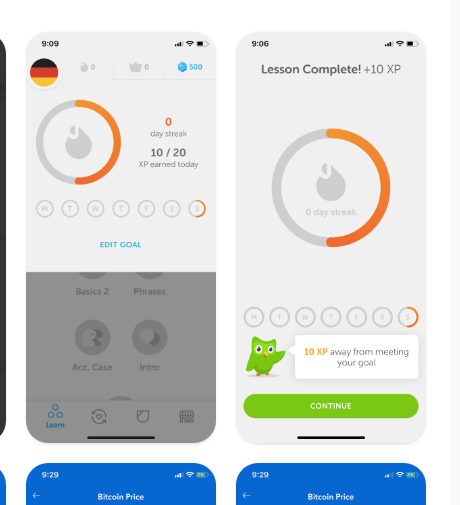
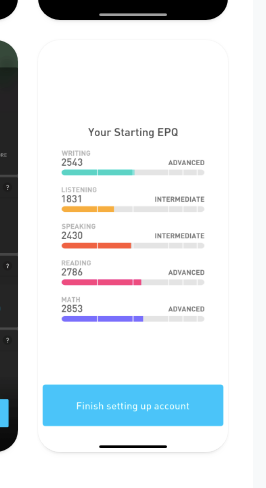
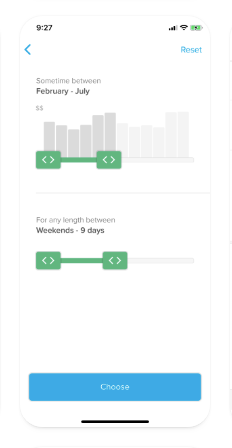
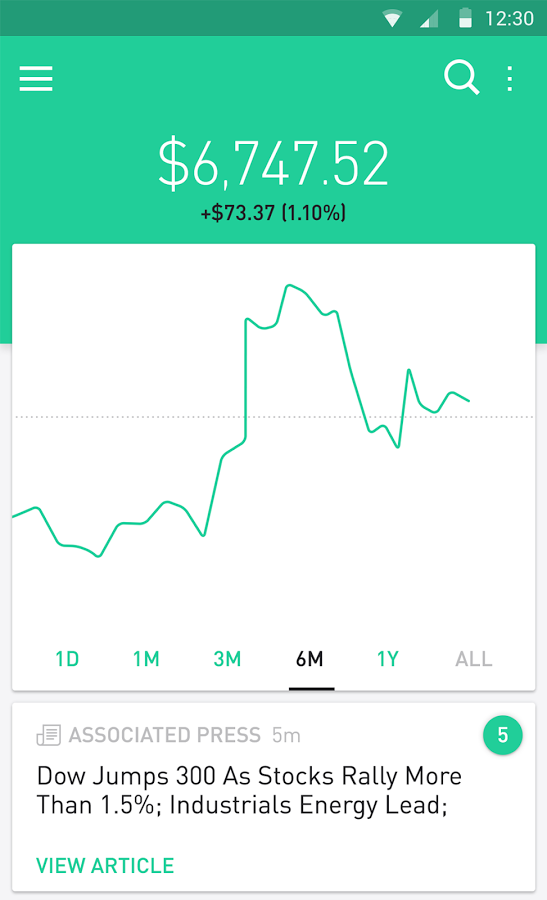
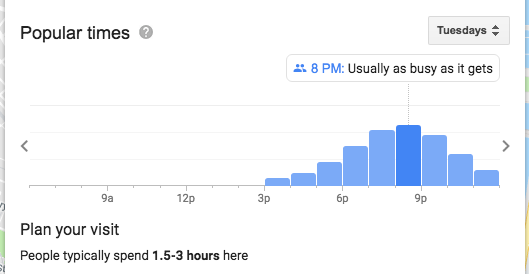
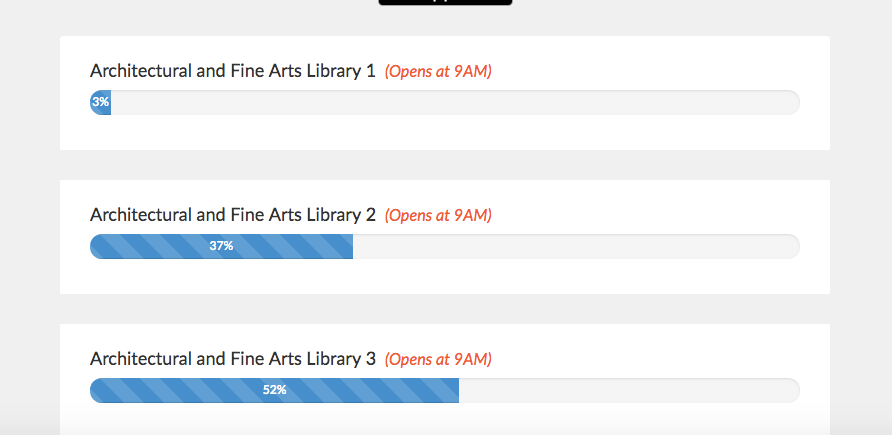
Google does a good job displaying Popular Times data with a simple and easy to understand bar graph. Robin hood displays stock data with a clean line graph. Others take different approaches. What would work for Density?
Low Fidelity Explorations
The designers and I whipped out our sketchbooks and drew out various ways to display Density data. We compiled and compared blueprints and took to the whiteboard to figure out which data formats fit best and which elements were necessary for the MVP.
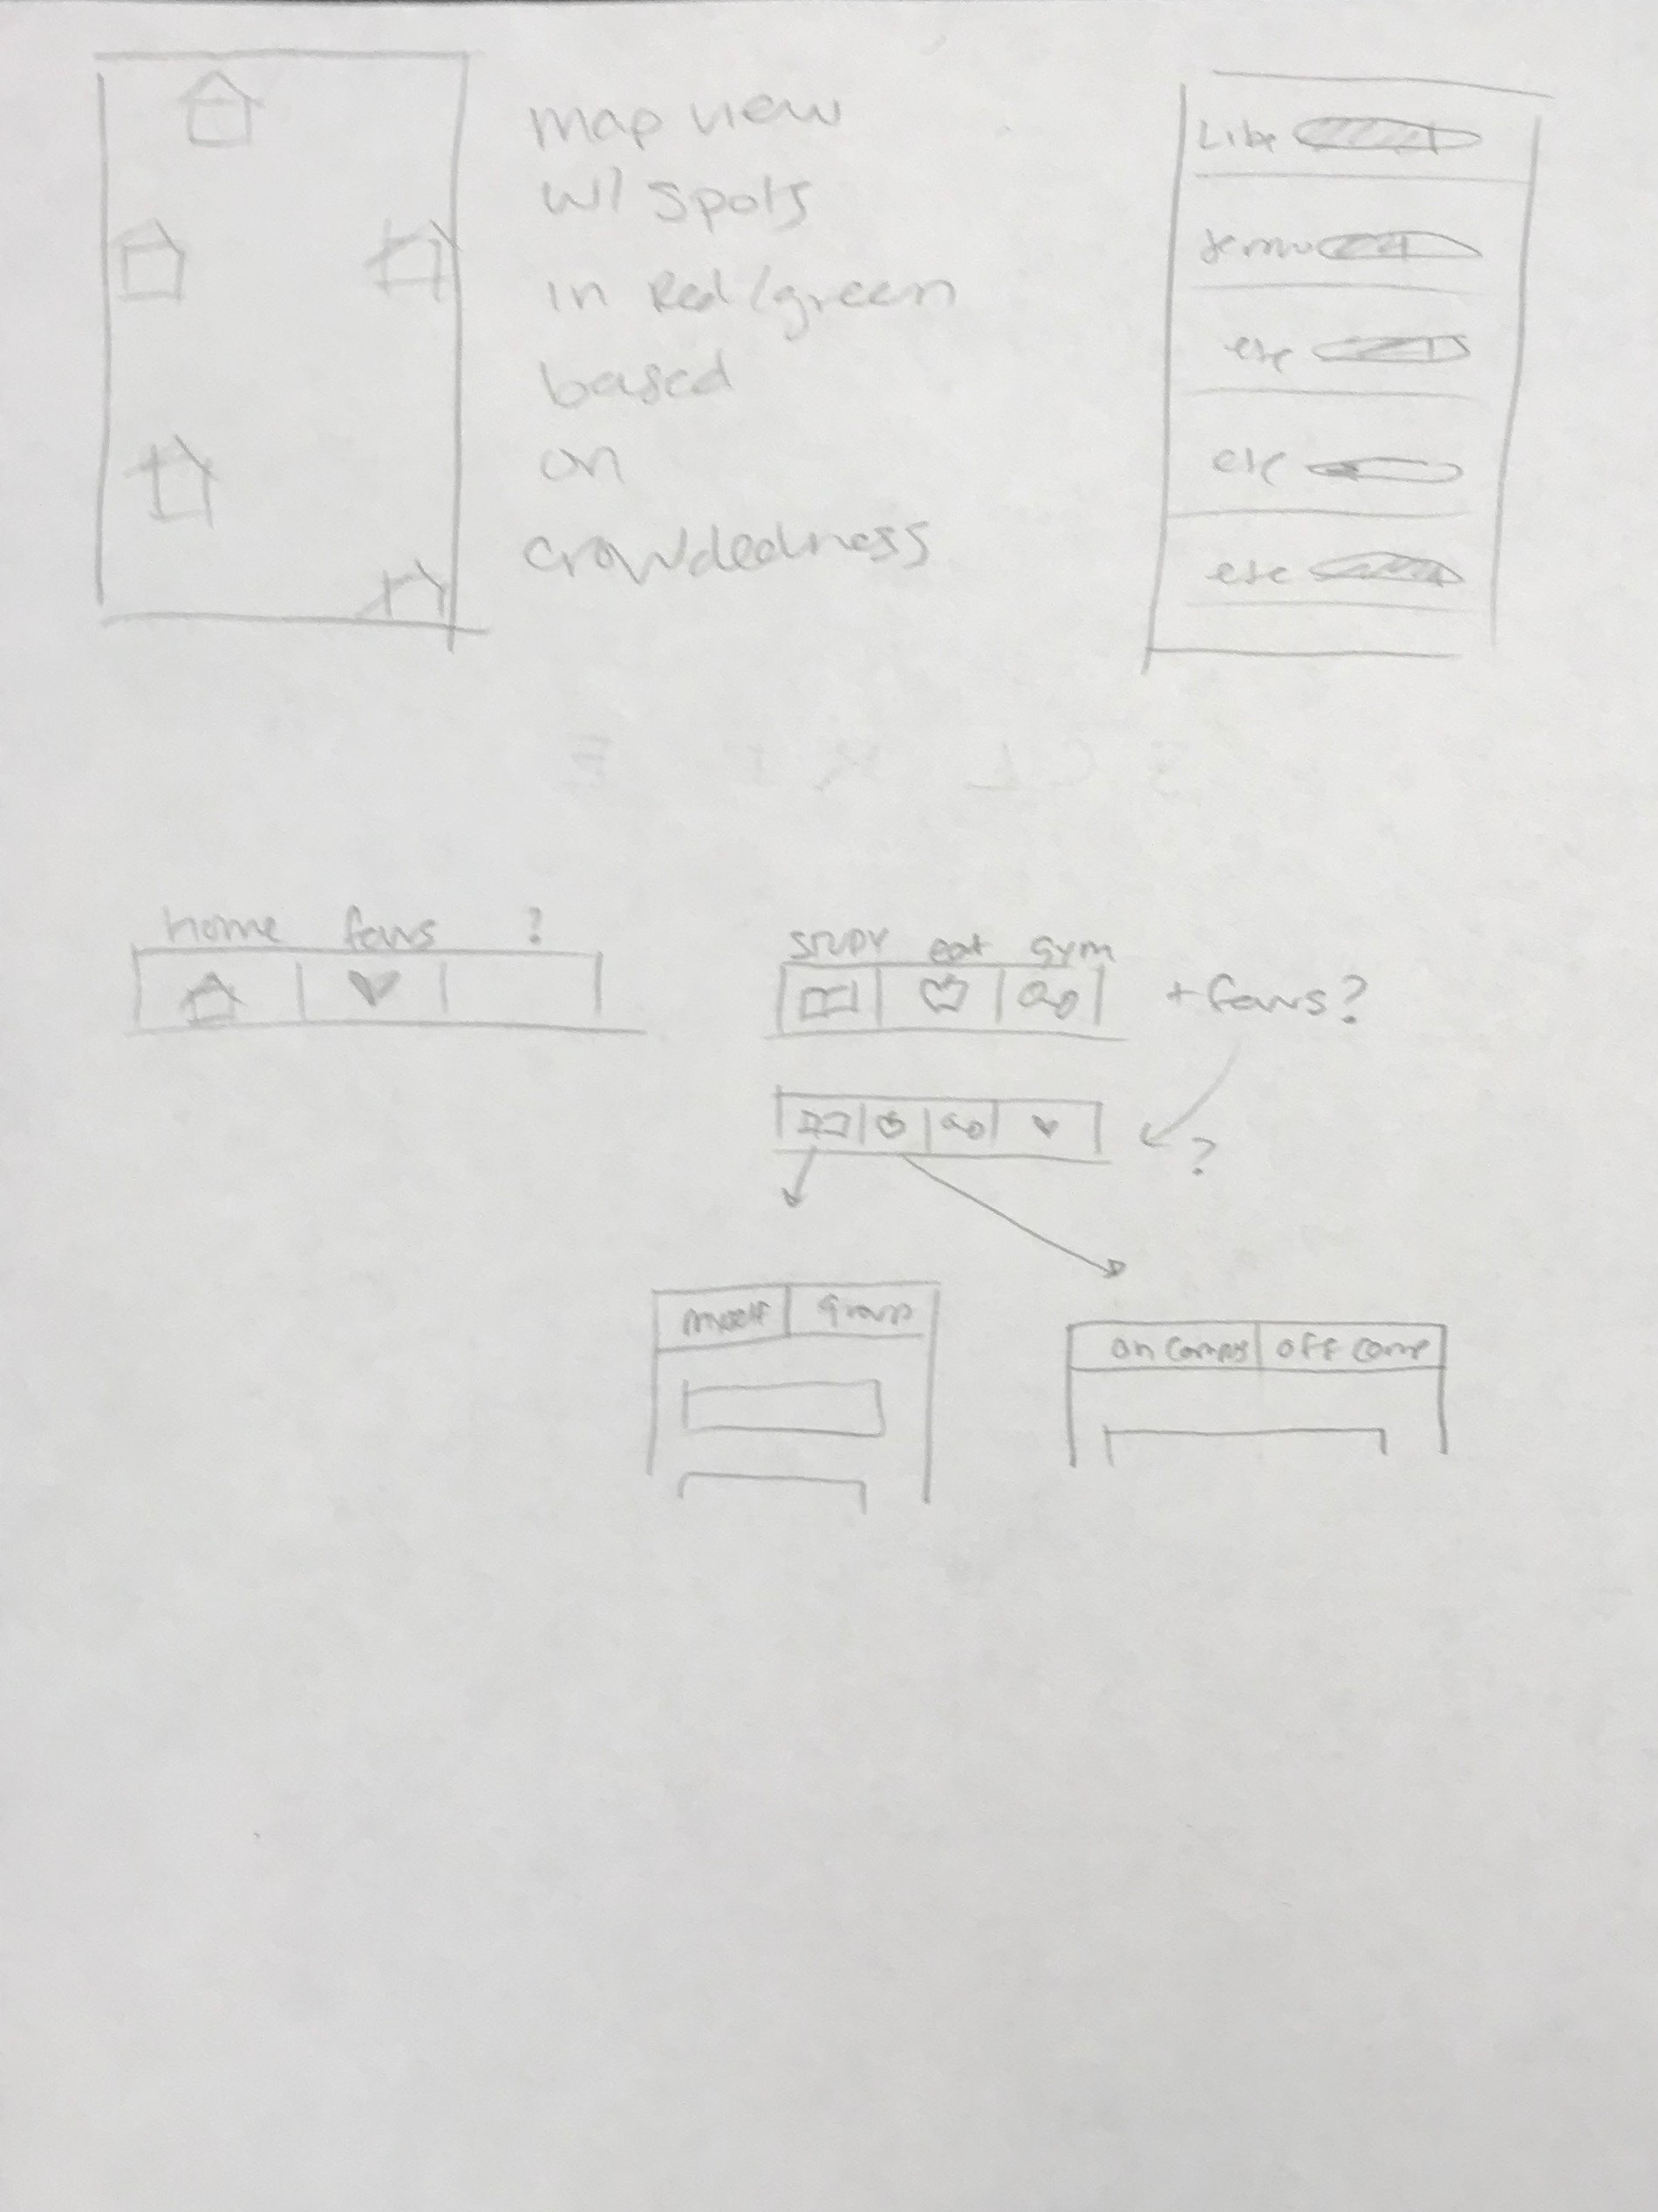
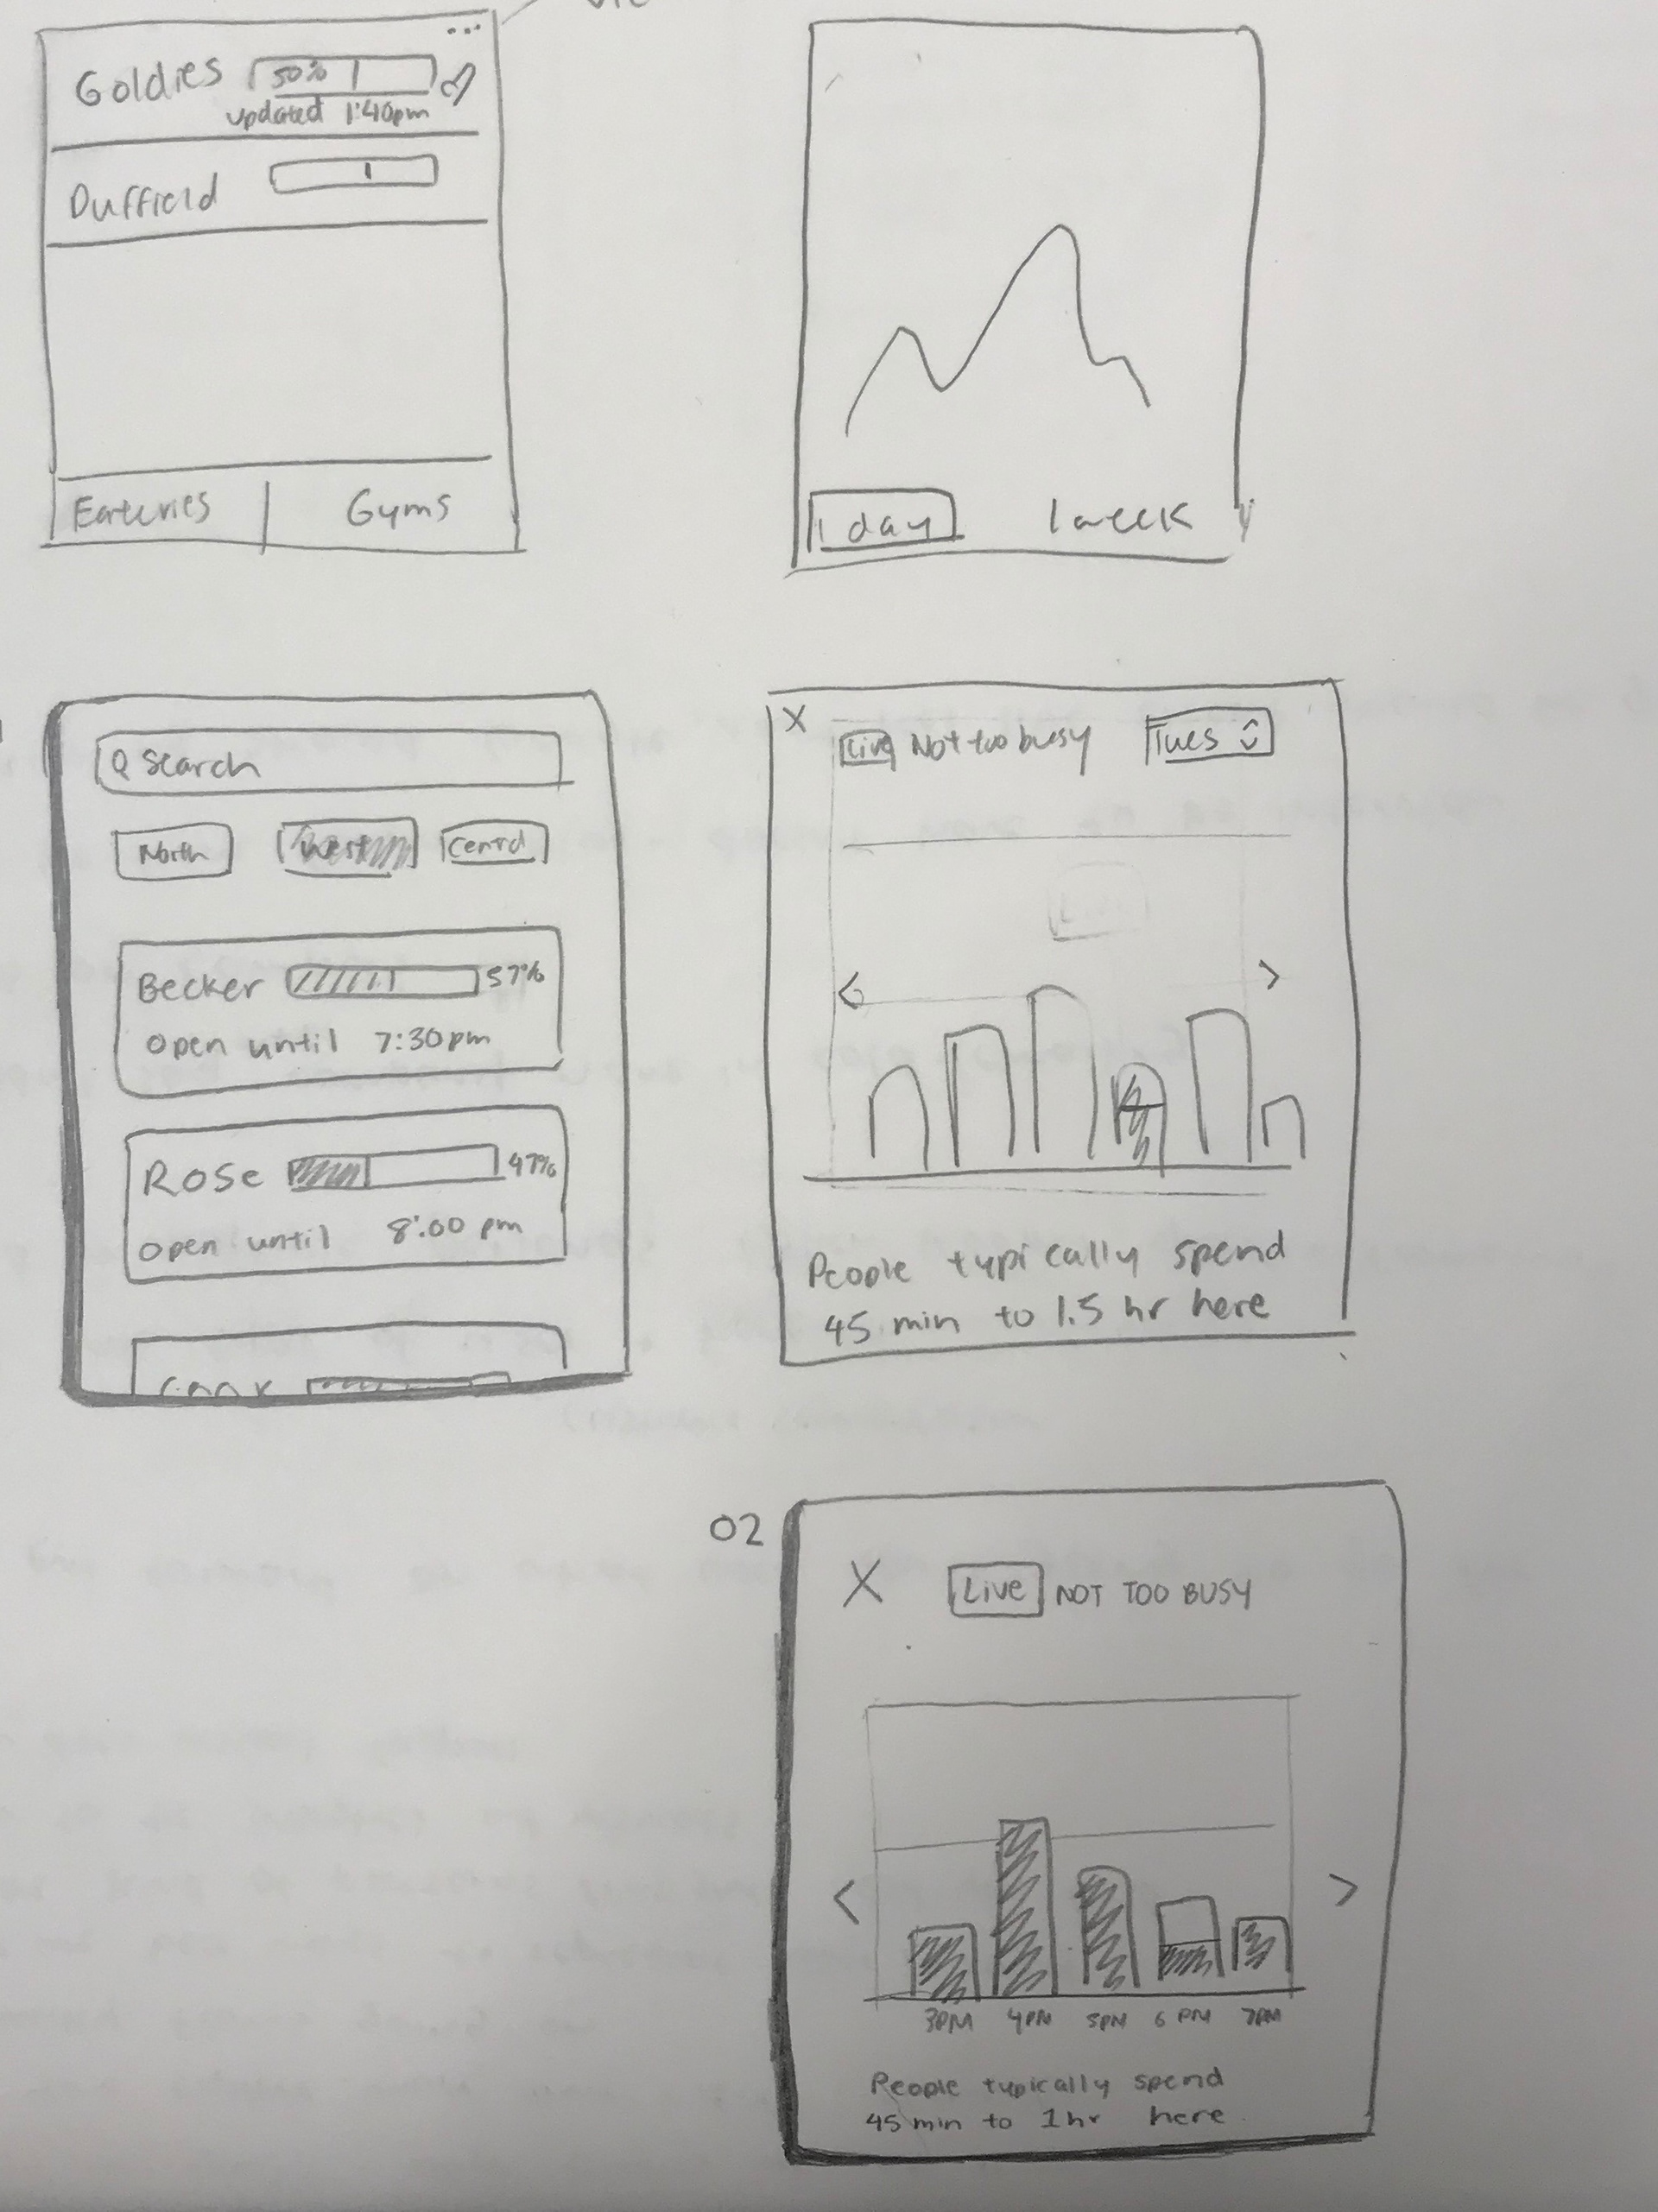
MVP Elements
Medium Fidelity Explorations
I took ownership over the homepage design process while another designer took ownership over the information card layout. We took a week to iterate and reconvened as a team.
Search bar
Option C - A clear and salient search bar suits Density's purposes best as it allows for easy access to the search function.
Cell Text Placement
Option B - I shifted the descriptor text over to the right upper hand corner of the cell to save space and visually even out the cells. The user will read left to right, seeing the most important information first: the eatery or dining hall name, and then the descriptor text second.
Visual Indicator to Represent Crowdedness
Option E - A challenge was finding the perfect balance between too little and too much information.
A fluid progress bar is unnecessarily precise and G, H, I were found to be too visually distracting and confusing.
After user research and design critique, it was found that segmented progress bars in fours served as the most easy to understand and visually pleasing to the eye. The broken progress bars breaks down crowdedness to four easy to understand options: 25%, 50%, 75%, 100% full.
Determining the Visual Design Language
I excitedly volunteered to head the visual design process and off I went.
But First, Inspiration
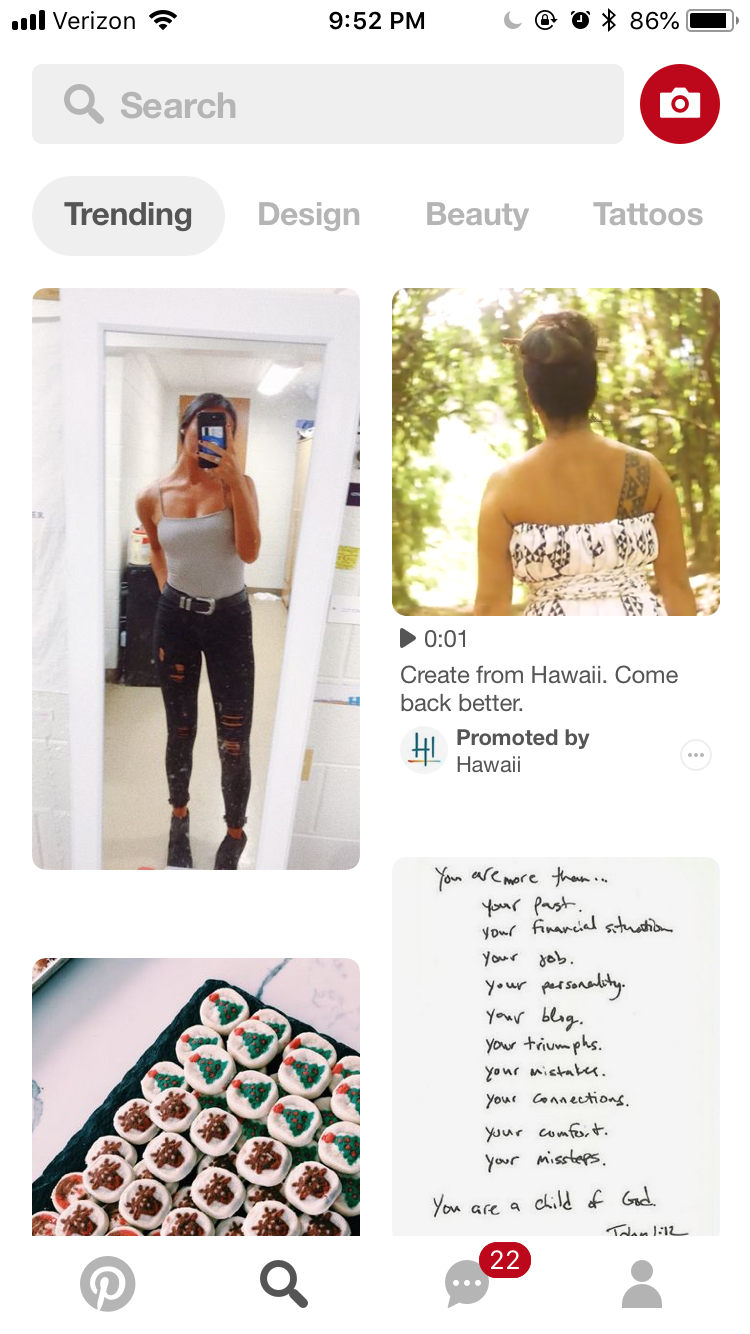
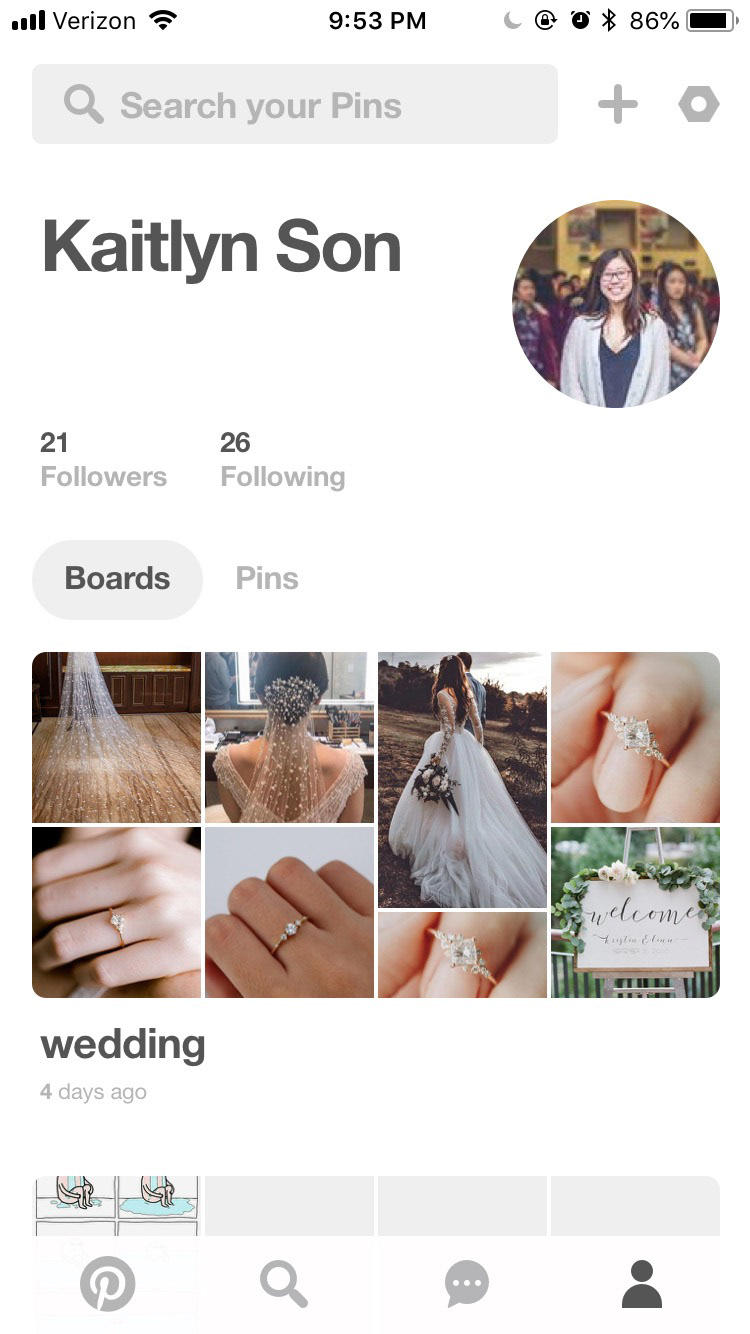
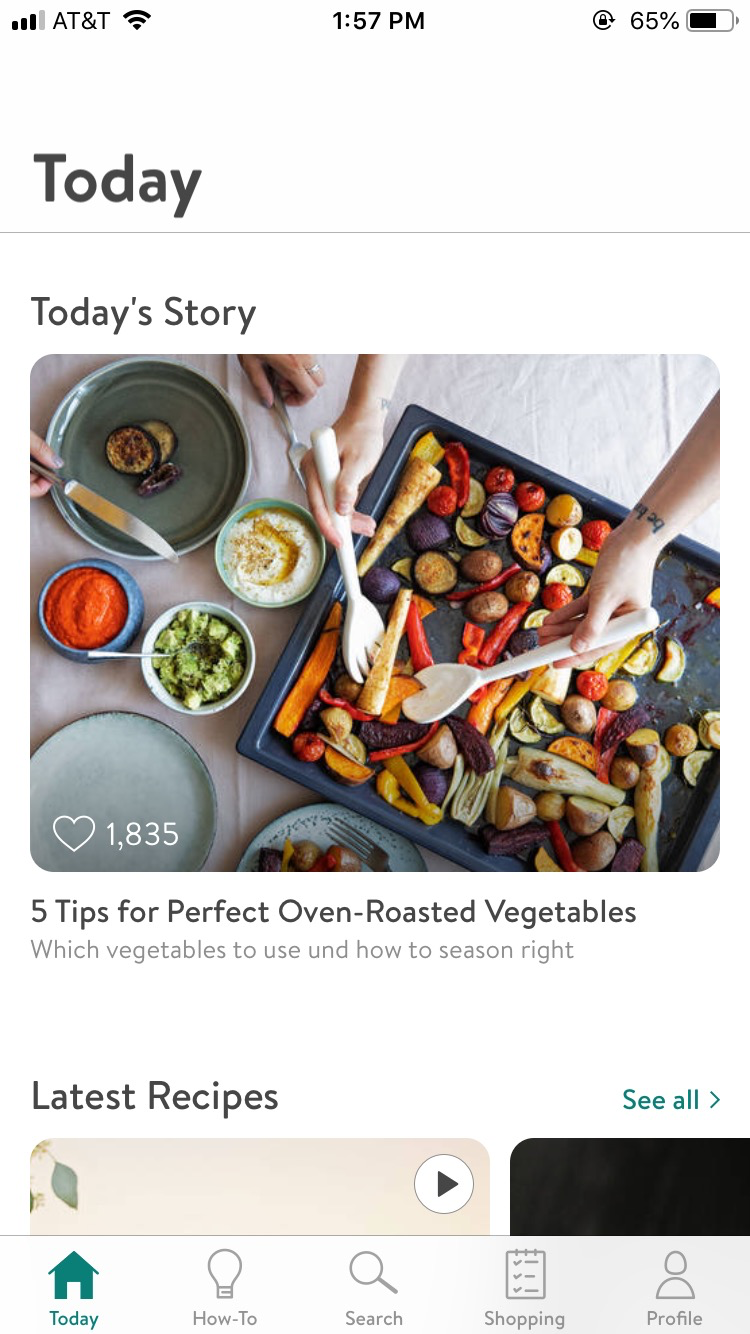
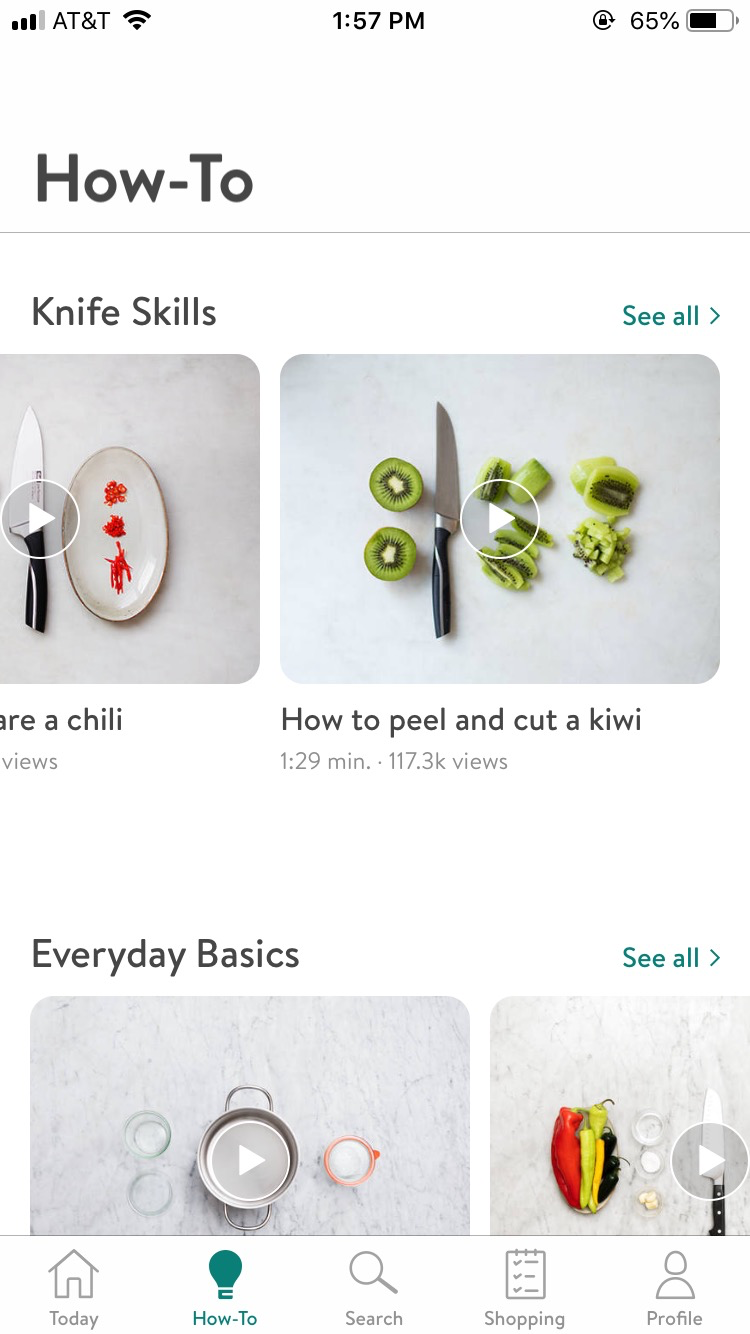
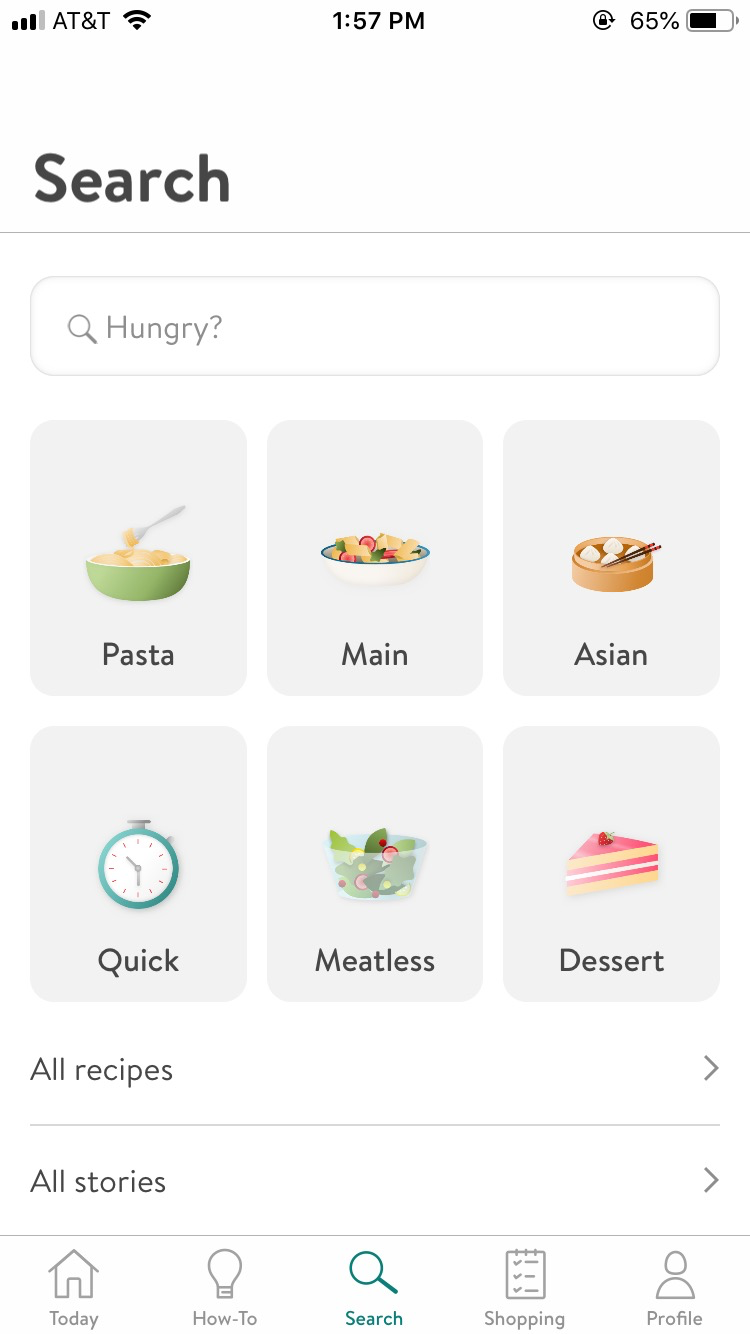
One of my favorite past times is scouring the internet for beautiful UIs. For this project I pulled inspiration from two apps I admire: Pinterest and Kitchen Stories. I adore their elegant, sleek, and minimalistic interfaces. Both apps share a similar white & grey aesthetic, with an understated highlight color, bubbly fonts, and rounded edges.
In the midst of students' hectic and busy lives, Density should bring organization and calmness to the user in choosing a destination, like the lightweight interfaces of Pinterest and Kitchen Stories.
Pinterest
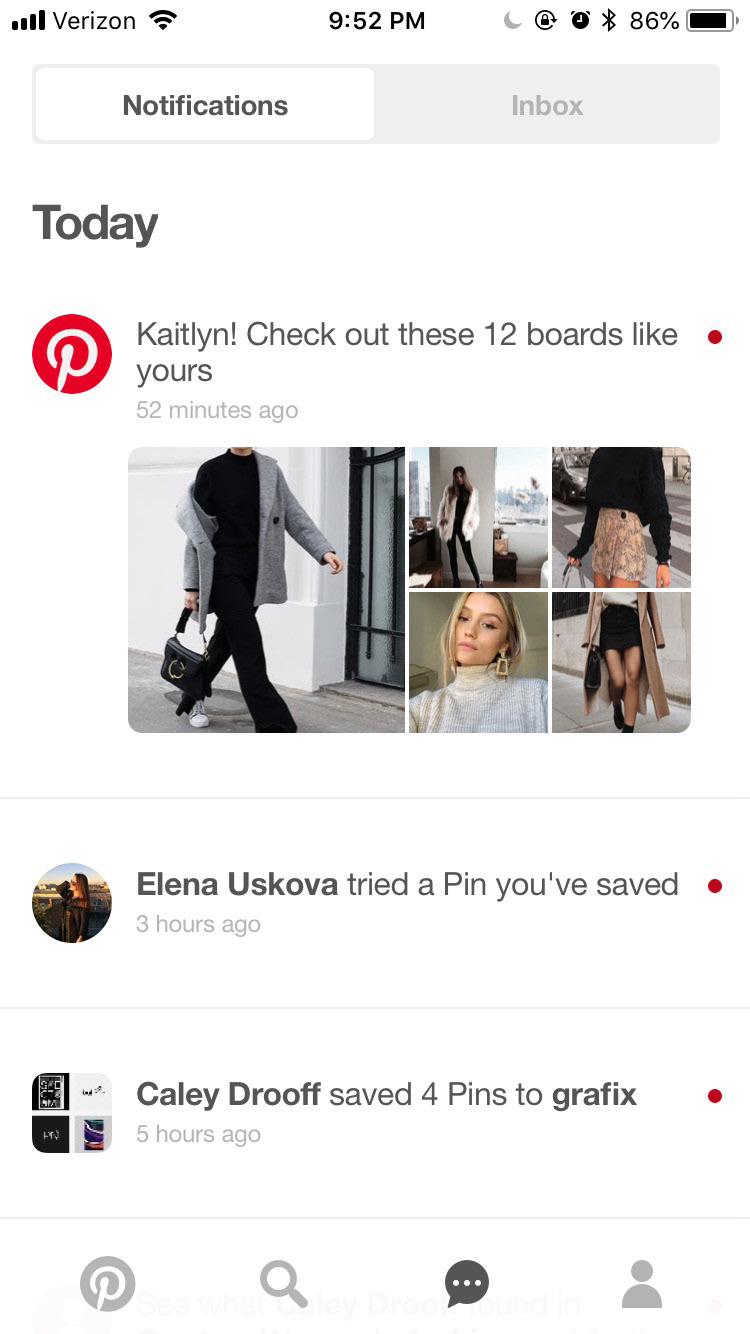
Kitchen Stories
High Fidelity and Visual Design Explorations
Color Palettes
Four Color Option - Using four colors: green, yellow, orange, and red are universal indicators for levels. proved to be the most easy to understand for users when tested. Still, Density's UI should remain relatively calming, and so I chose softer, pastel tones and an off white paper color for the background.
Delimiters
Option B - After critique, the designers of DTI and I agreed that the most fitting cell delimiter was the rounded squoval in option A due to its clickable appearance. The pronounced cell draws more visual attention than other other options.
Final Prototype
✅
Home Page Features
Search: Allows user to directly find favorite spots on campus
Location Filters: Allows user to search based upon location on campus
Cells: Proves user with real time data regarding the fullness of that facility
Info Page Features
Favorite Button: Allows user to save facility to their favorites filter
Popular Times Graph: Displays most popular times based upon historical data. Updated weekly
Hours of Operation: Displays when facility is open on given day
Accuracy Check: Allows user to input how full they think the facility is. Provides insight to Density team, allowing us to become more accurate
Preparing for Soft Launch
Promotional Material
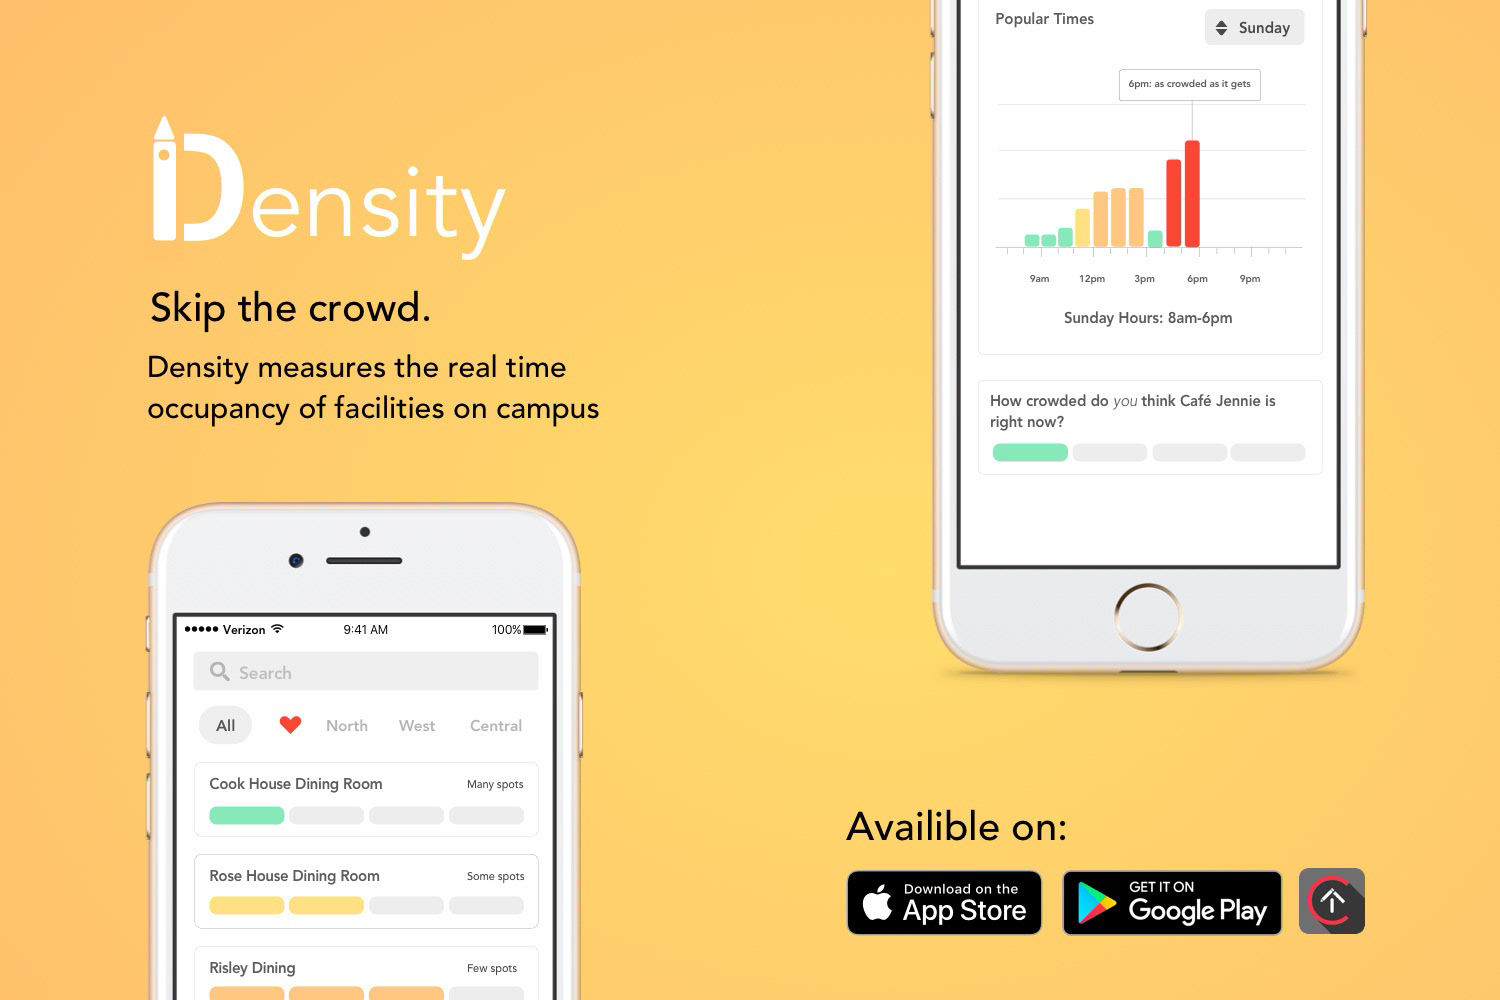
It was time to release our work into the (Cornell) world. As our team rushed against the clock (the semester ending) to get the MVP onto both the App Store and Google Play, our design team split up to take on different tasks. I pulled together promotional quartercards and posters for our release. Another designer worked on the App Store banners. Our third designer crafted the logo. Our PMs worked on promoting the App through social media and digital means.
Concluding Remarks & Looking Forward
We were only able to get the app on Google Play in time for finals. In the midst of finals, our team worked to test the app’s basic functionality, correct bugs, and pin point areas of improvement for next semester. We conducted user interviews with the iOS version of the app in TestFlight and discovered that our in-app wording may need refining.
For the next semester we will be iterating off feedback, tightening up our designs and code, and gathering even more feedback. We will be expanding to include study spaces as well. I’m excited to dive deeper and work harder to solve the problems our campus faces and I look forward to the progress to come. 💪🔥😤